

Background
The Challenge: Limited Flexibility
In 2001, permittees in Rich County, UT sought to change their grazing systems to increase economic stability and improve ecological conditions on the public lands they use for grazing. The current public land management system divides rangelands into allotments that producers lease for their operations. These small units limit ranchers’ grazing management flexibility.
The Solution: Innovative Management
To address the lack of flexibility in current grazing practices, Rich County stakeholders proposed the Three Creeks Grazing Allotment Consolidation Plan. The new grazing plan involves consolidating 10 public-land allotments and combining permittees’ herds under one LLC. Two herds are rotated across the whole landscape, allowing more flexibility with grazing location, duration, and timing. Developing the new plan took intense collaboration among several partners including permittees, the Bureau of Land Management (BLM), the Utah Department of Agriculture’s Grazing Improvement Program (UGIP), and the US Forest Service.


As of 2022, all pastures are now grazed with the Rest-Rotation system.
-
Three Creeks Grazing, LLC
Utah Grazing Improvement Program (UGIP)
Bureau of Land Management (BLM)- Salt Lake Field Office
Natural Resource Conservation Conservation Service (NRCS)- Price Field Office
USDA National Institute of Food and Agriculture:
Western Sustainable Agriculture Research and Education
Agriculture and Food Research Initiative
Nevada Soil Ecology Lab
Paul Grossol- Utah State University

Working Lands Conservation is working with this innovative group to understand if the new grazing plan leads to the desired outcomes for partners and the land.
WLC will monitor changes in ecological conditions as partners implement new grazing strategies. This information will be shared collectively to inform adaptive management of the Three Creeks Project.
We monitor a variety of ecosystem services to understand changes across the whole landscape.
VEGETATION
Data Collected
-
Stubble height is herbaceous plant height in a grazed system. We measure stubble height to understand how vegetation recovers after grazing. Stream banks, or riparian areas, are usually trafficked heavily by livestock. By recording the height of riparian plants throughout the grazing season, we can understand how plants respond to the new grazing system.
-
Natural resource managers are concerned with the population of the Greater Sage Grouse. During the spring and summer, they rely on forbs (herbaceous flowering plants) for food. By monitoring species composition, we can understand how the change in grazing affects sage grouse habitat.
-
We measure total forage production by clipping and weighing dried herbaceous biomass.

Photo: Zach Altman, Western Landowners Alliance
These data answer questions about
-
Metric
Measured as total herbaceous biomass and stubble height.
Justification
Vegetation in riparian areas affects the amount of forage available for cattle grazing, contributes to the quality of wildlife habitat for species such as sage-grouse (Stiver et al. 2015, Messmer and Dahlgren 2018), and may influence water quality affecting fish habitat (Pusey and Arthington 2003). Rangeland forage production is often estimated using direct collection methods or estimation methods. Direct collection methods are quantitative, but the process is time intensive and because study plots are destructively harvested, provide only a snapshot of biomass at one point during the grazing season. In contrast, double-weight methods do not require destructive clipping, and thus data is faster to collect, but this method takes extensive training and results can be subjective. In our study, to try to assess biomass and trends of recovery throughout the grazing season, we use direct biomass collection late in the season (August) in combination with stubble height measurements throughout the grazing season (May- September). Stubble height has long been used in riparian areas to evaluate health but is not used to evaluate production. Despite this, stubble height is useful for understanding how vegetation recovers post-grazing.
Analysis
We used repeated measures GLMs for each metric in each year. We employed a multivariate analysis to determine within-subjects effects due to the data’s violation of sphericity assumptions.
-
Metric
Stubble Height and forb cover
Justification
Steam-side areas serve as prime habitat for sage-grouse broods during early to mid-summer (Stiver et al. 2015). We draw habitat guidelines from the Sage-grouse Habitat Assessment Framework (HAF) (Stiver et al. 2015) and Utah State University researchers whose work focuses more specifically on the regional habitat needs of sage-grouse in Rich County (Dahlgren et al. 2019). Metrics include (a) total grass height, total forb height, or a combined stubble height, all of which serve as cover for young sage-grouse, and (b) total perennial forb cover with forbs serving both as food for chicks and as host plants to the insects chicks eat (Stiver et al. 2015).
According to sage-grouse habitat guidelines, taller grass/perennial forbs and more grass/perennial forb cover directly correlate with better sage-grouse habitat (Stiver et al. 2015). This is because taller stubble can provide sage-grouse and chicks with cover for hiding from predators, while forbs serve both as food for chicks and are host plants to the insects chicks eat (Dahlgren et al. 2015). We examine all herbaceous metrics in our study.
Analysis
We used repeated measures GLMs for each metric in each year. We employed a multivariate analysis to determine within-subjects effects due to the data’s violation of sphericity assumptions.
-
Metric
We collected bare ground data at the same time as we collected stubble height (May - September) using point-intercept methods along transects and in cages. We recorded the number of points out of the 200 per transect and 45 per cage that landed on bare ground.
Justification
Grazing along streams can affect the amount of bare ground on streambanks, thus influencing streambank stability; in particular, more bare ground leads to higher erosion rates (George et al. 2011).
Analysis
We used repeated measures GLMs for each metric in each year. We employed a multivariate analysis to determine within-subjects effects due to the data’s violation of sphericity assumptions.
-
DAHLGREN, D. K., T. A. MESSMER, B. A. CRABB, M. T. KOHL, S. N. FREY, E. T. THACKER, R. T. LARSEN, AND R. J. BAXTER. 2019. SAGE-GROUSE BREEDING AND LATE BROOD-REARING HABITAT GUIDELINES IN UTAH. WILDLIFE SOCIETY BULLETIN 43:576-589
DAHLGREN, D. K., E. T. THACKER, AND T. A. MESSMER. 2015. WHAT DOES A SAGE-GROUSE EAT? USU EXTENSION BULLETIN NOVEMBER 2015:3
GEORGE, M. R., R. D. JACKSON, C. S. BOYD, AND K. W. TATE. 2011. A SCIENTIFIC ASSESSMENT OF THE EFFECTIVENESS OF RIPARIAN MANAGEMENT PRACTICES. PAGES 213-252 IN D. D. BRISKE, EDITOR. CONSERVATION BENEFITS OF RANGELAND PRACTICES: ASSESSMENT, RECOMMENDATIONS, AND KNOWLEDGE GAPS. ALLEN PRESS, LAWRENCE, KS
PUSEY, B. J., AND A. H. ARTHINGTON. 2003. IMPORTANCE OF THE RIPARIAN ZONE TO THE CONSERVATION AND MANAGEMENT OF FRESHWATER FISH: A REVIEW. MARINE AND FRESHWATER RESEARCH 54:1-16
STIVER, S. J., E. T. RINKES, D. E. NAUGLE, P. D. MAKELA, D. A. NANCE, AND J. W. KARL. 2015. SAGE-GROUSE HABITAT ASSESSMENT FRAMEWORK: A MULTI-SCALE ASSESSMENT TOOL. BUREAU OF LAND MANAGEMENT AND WESTERN ASSOCIATION OF FISH AND WILDLIFE AGENCIES, DENVER, COLORADO
soils
Soil health underlies many rangeland ecosystem processes such as vegetation recovery, forage production, and erosion control. Despite its importance, relatively little is known about how innovative grazing systems influence soil health in rangeland environments.
We need a better understanding of the links between cattle grazing and soil processes to inform both production and land management goals. Because most soil health research in the U.S. has focused on croplands rather than rangelands, there is limited knowledge about how grazing timing, duration, and intensity affect key soil health indicators. There is also a need to study how grazing systems function across large and diverse landscapes. Additionally, soil assessment methods should be streamlined to reduce barriers to monitoring and adaptive management.
Data Collected
-
Infiltration is an indicator of the soil’s ability to allow water movement into and through the soil profile. Soil temporarily stores water, making it available for root uptake, plant growth and habitat for soil organisms.
-
Soil is a major storage reservoir for water. In areas where plants remove more water than is supplied by precipitation, the amount of water held by the soil may be critical. By holding water for future use, soil buffers the plant – root environment against periods of water deficit.
-
Changes in stability may serve as early indicators of recovery or degradation of soils. Stability is an indicator of organic matter content, biological activity, and nutrient cycling in soil.
-
Bioavailable nitrogen is needed for the nutrition and growth of plants and soil microorganisms.
-
Healthy soils are full of life! Microbes play key roles in the decomposition of soil organic matter, nutrient cycling, soil pollutant degradation, and the formation and stability of soil structure.
-
Soil respiration reflects the capacity of soil to support soil life including plants, soil animals, and microorganisms.
-
Soil organic carbon is one of the most important constituents of the soil due to its capacity to affect plant growth as both a source of energy and a trigger for nutrient availability through mineralization.

These data answer questions about
-
Metrics
Infiltration, moisture, structural stability, bioavailable nitrogen, microbial biomass, microbial respiration, and soil carbon
Justification
We selected six metrics of soil health that are expected to change in response to grazing within the timeframe of this project, and are interpretable either by themselves or in conjunction with one another as a representation of specific processes and conditions relevant to rangeland health and the generation of ecosystem services. These metrics include infiltration, moisture, structural stability, bioavailable nitrogen, microbial biomass, and microbial respiration.
Analysis
We use separate linear mixed effects models to determine the legacy effects of different grazing systems on soil health and carbon.
-
Soil organic carbon is a key driver of how rangelands respond to drought. Higher levels of soil carbon improve soil structure, boost water-holding capacity, and support microbial communities that help maintain soil function in dry conditions. For ranchers, this means more reliable forage production, healthier vegetation, and greater stability in grazing operations during drought years. Measuring soil carbon can offer valuable insight into a ranch’s drought resilience—and inform management practices that build long-term sustainability on working lands.
WATER
We are able to examine how quickly pollutants respond to cattle movement in and out of pastures and determine if the new Three Creeks grazing system can be used to maintain water quality that meets Utah Department of Water Quality (UDWQ) standards.
-
E.coli (Escherichia coli) is a type of coliform bacteria that enters waterways through fecal matter of warm-blooded animals. People can become sick when exposed to contaminated water. WLC monitors with the UDWQ-approved IDEXX method.
-
The pH scale is the measure of the acidity or basicity of water. Organisms have different levels of tolerance to pH. Monitoring pH can inform if habitat is improving or declining
-
Similar to pH, species have different tolerances to water temperature. Monitoring informs habitat quality.
-
Dissolved solids is the sum of all the chemical ions dissolved in the water.
-
The amount of oxygen in streams is critical to fish habitat. Low DO levels indicate poor habitat.
-
Discharge is the volume of water flowing through a stream. It is an important qualifier of other water quality metrics on the potential effects of contaminants.

Photo: Zach Altman, Western Landowners Alliance
These data answer questions about
-
Metric
E. coli, pH, temperature, dissolved oxygen, total dissolved solids
Justification
We use metrics outlined by the Utah Department of Environmental Quality-Division of Water Quality (UDWQ) important for human health, fish populations, water supplies, and recreation.
Analysis
We examined what percent of the recreation season (May - October) streams were above Utah’s designated thresholds for each water quality metric.
PROJECT UPDATES
We teamed up with Western Landowners Alliance and a professional film team to tell the amazing story of Three Creeks. Get to know the people behind a now thriving landscape, flourishing communities, and an unprecedented step forward in stewardship of working lands.
After four years under the new grazing system, our monitoring suggests that implementation of time-controlled rotational grazing improved multiple metrics of rangeland health. The most notable improvement is found in pastures that were historically grazed for season-long durations. These pastures saw increases in biomass and stubble height, in addition to decreases in erosion potential along streams and E. coli concentration in streams. We’ve seen some fluctuation due to weather and other unpredictable factors, yet as of 2025, all streams measured on Three Creeks are now passing state water quality standards! We hope to continue to see this improvement as the landscape heals and becomes more resilient to disturbances and climatic variation.

Sage Creek 2021
Season-long continuous grazing
September, grazed for the season

Sage Creek 2022
Rest Rotation Grazing
September, grazed for the season

Sage Creek 2023
Rest Rotation Grazing
September, grazed for the season
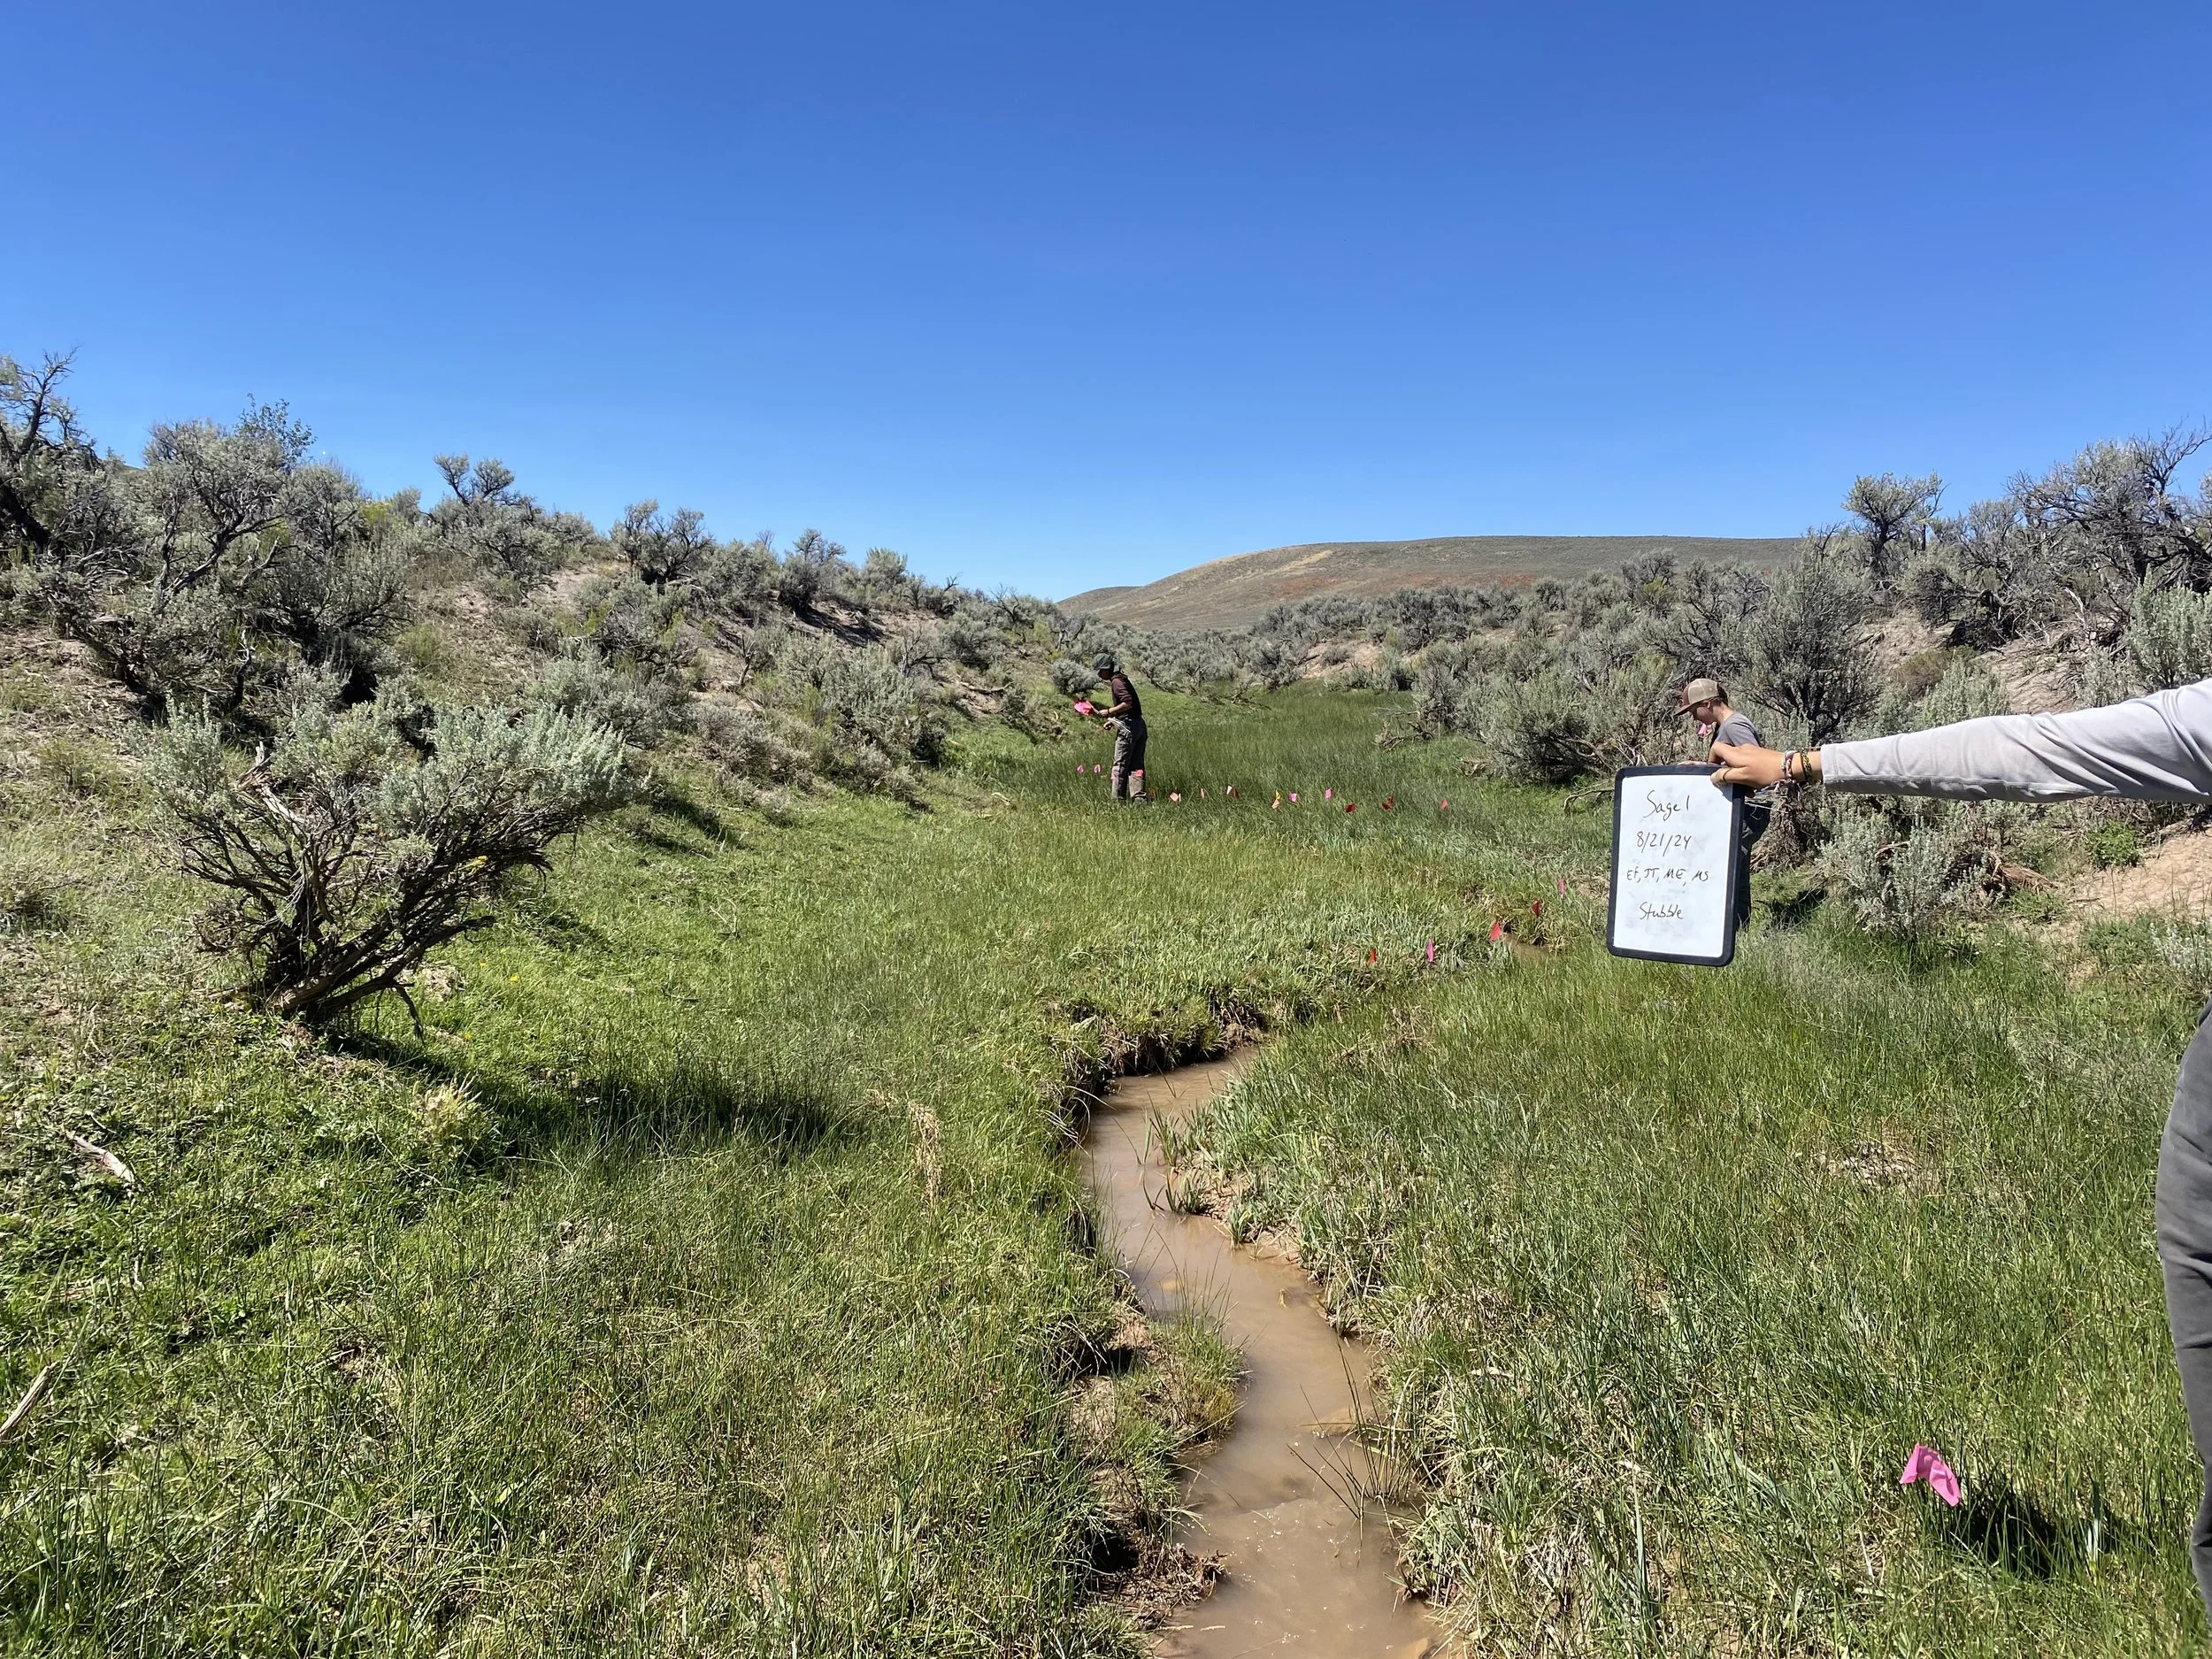
Sage Creek 2024
Rest Rotation Grazing
August, grazed for the season
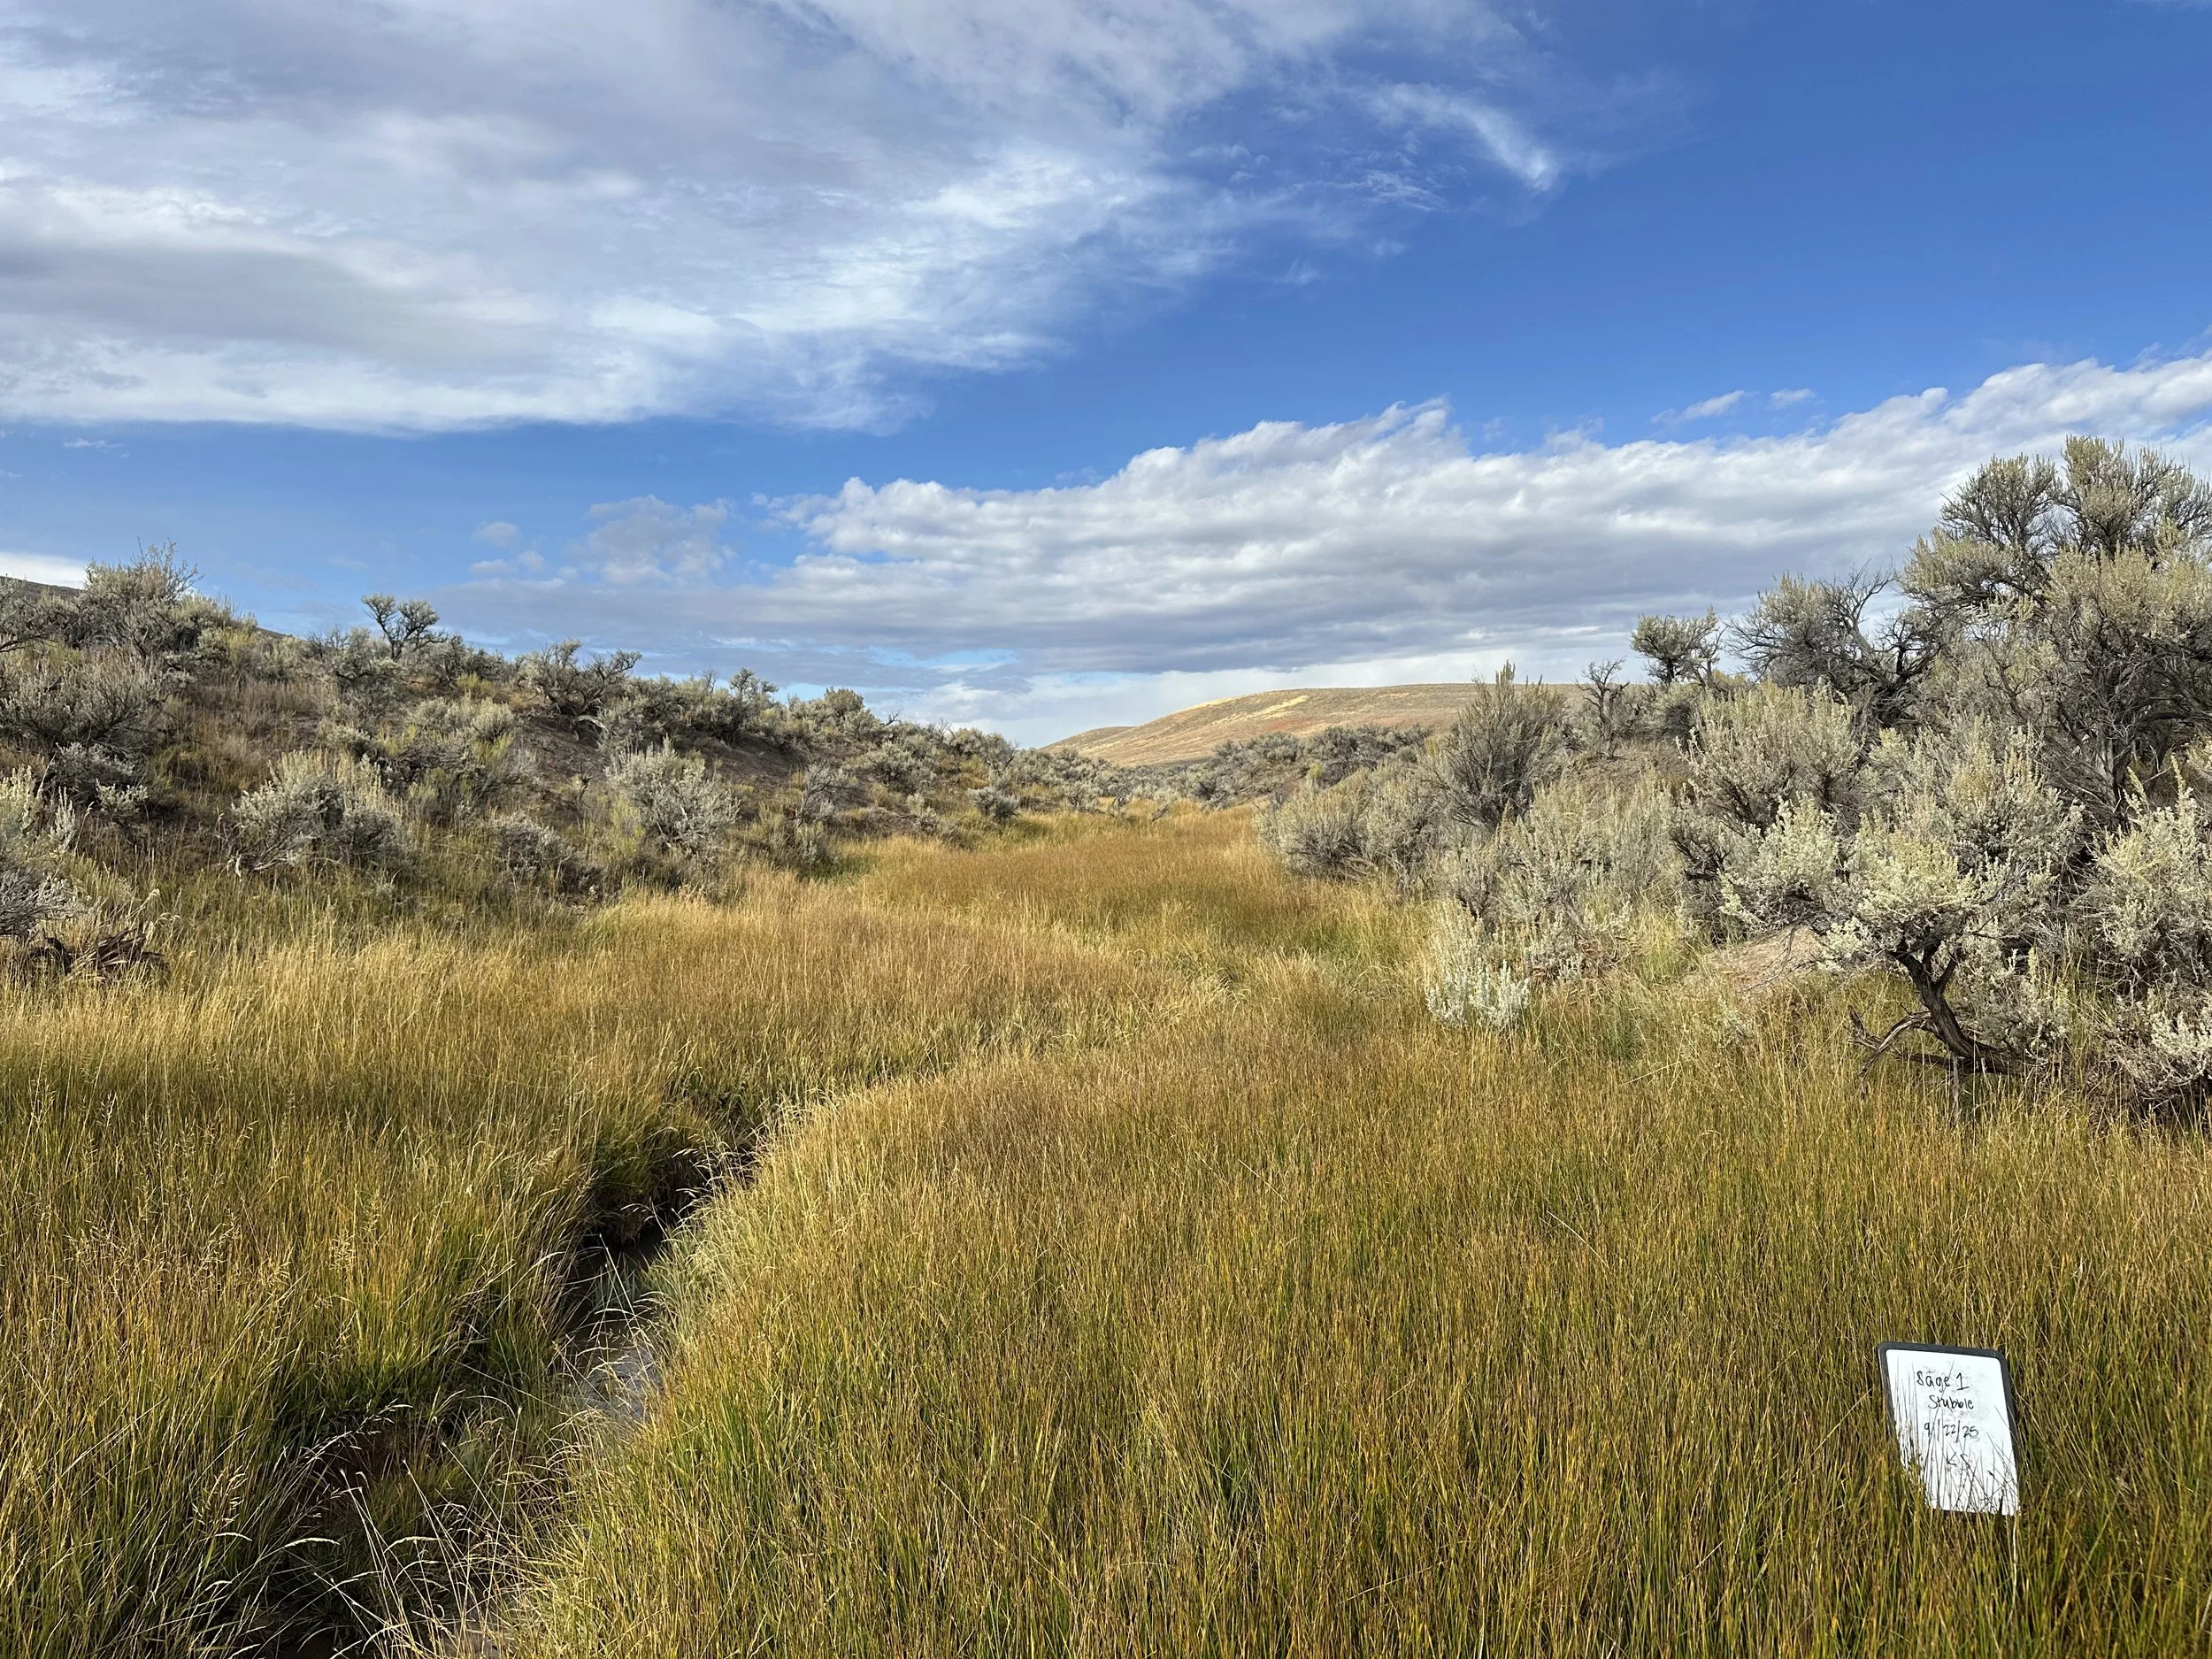
Sage Creek 2025
Rest Rotation Grazing
September, grazed for the season
Innovative Grazing on Public Lands: Lessons from the Three Creeks Project
Listen to Taylor Payne (Utah Grazing Improvement Program) and WLC’s Kris Hulvey share lessons learned from this project.